Dear reader,
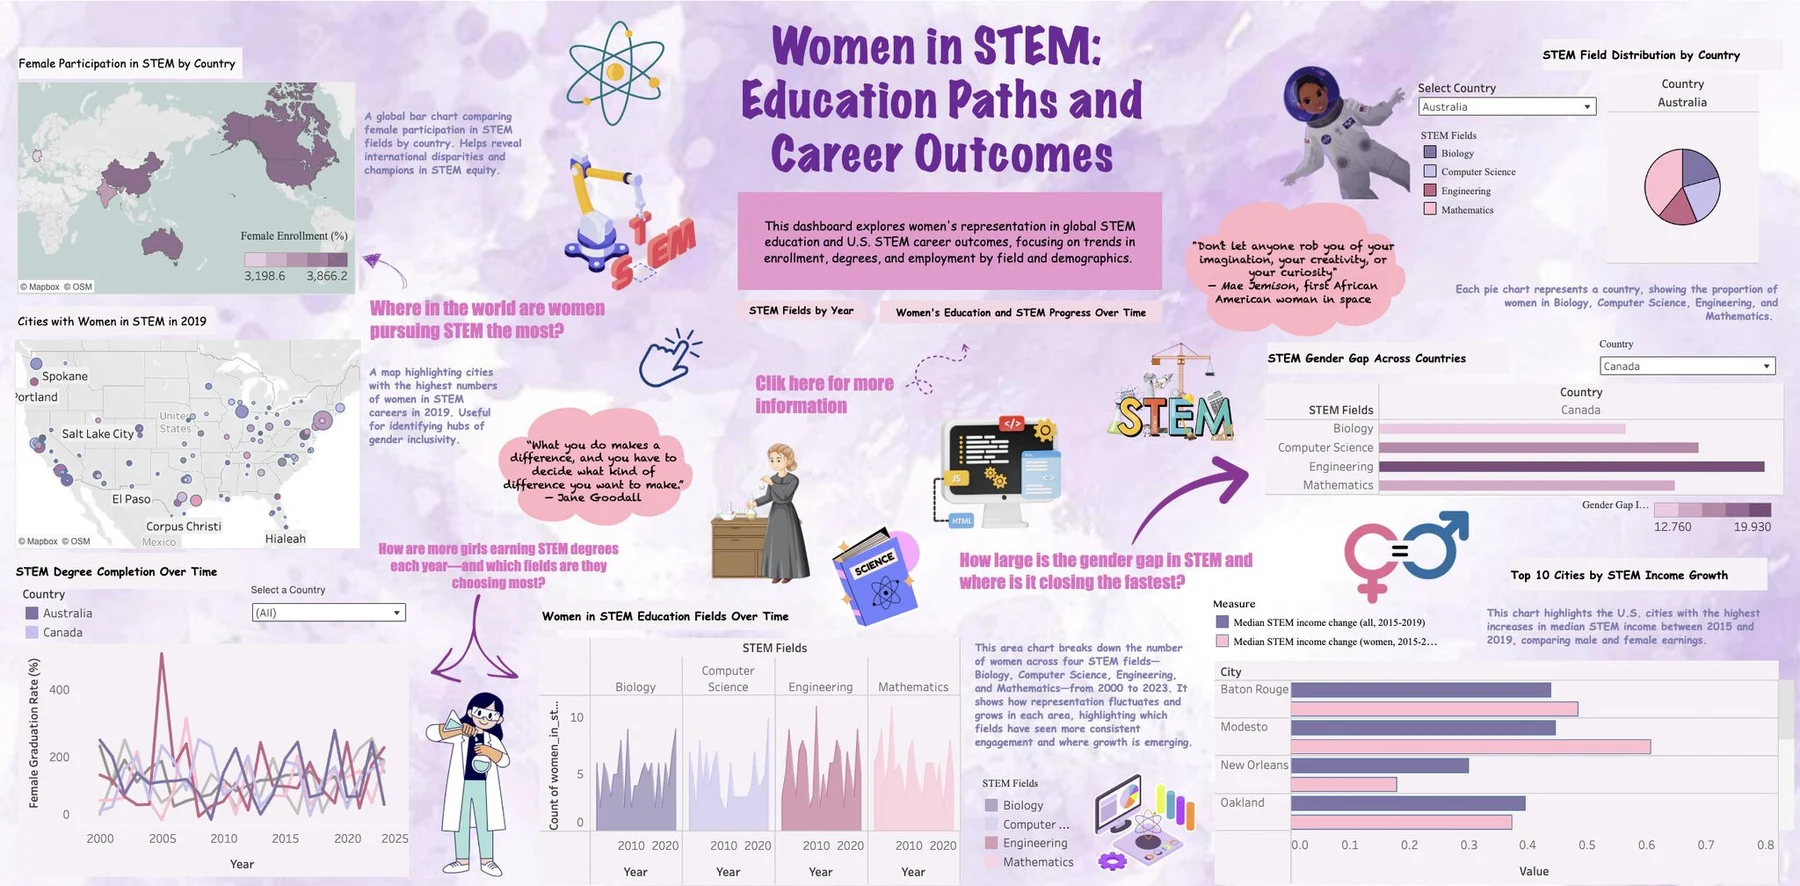
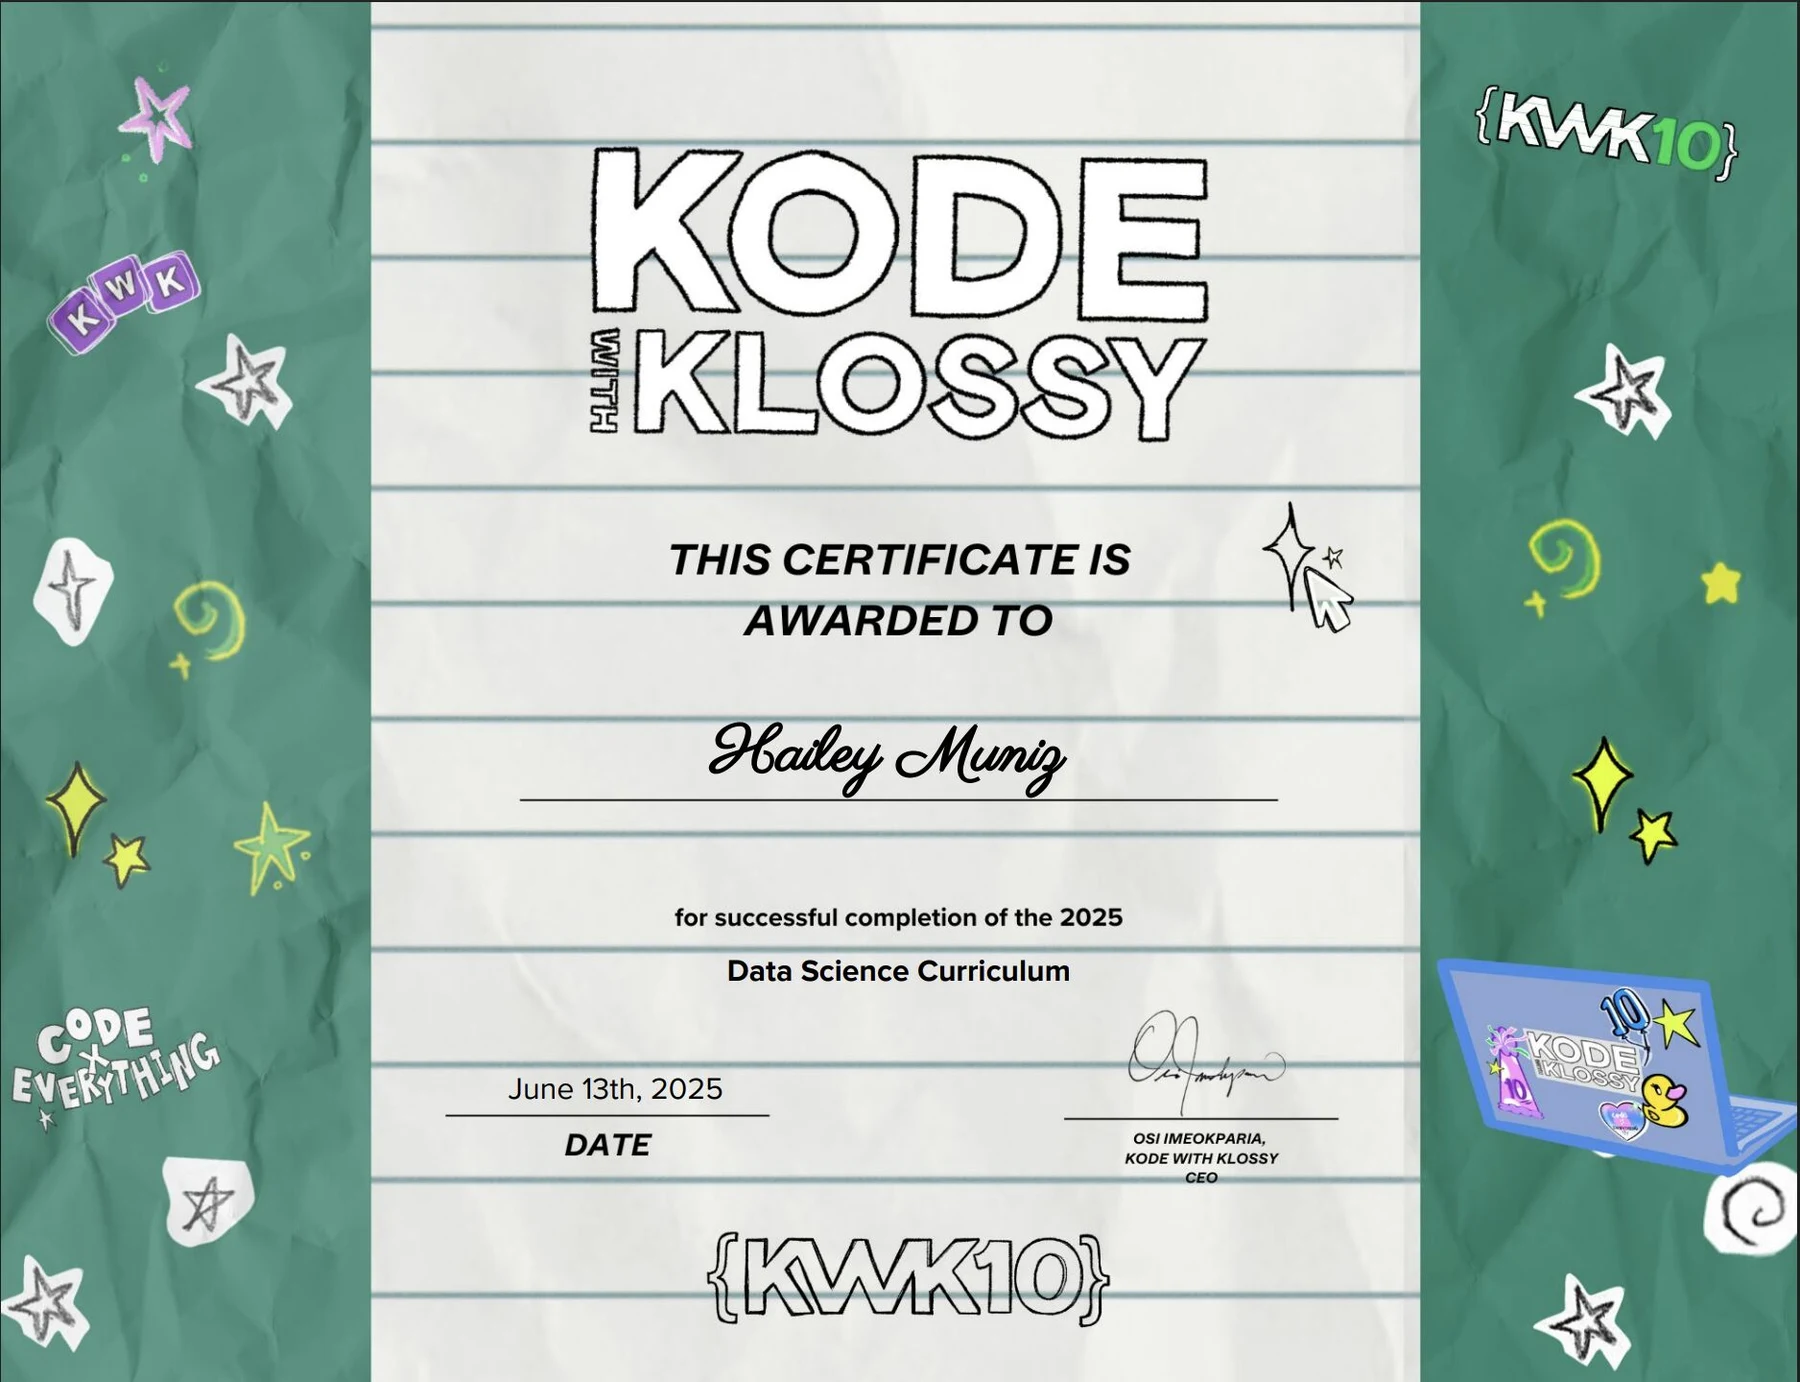
Over two weeks at Kode with Klossy, I learned SQL and Tableau while exploring how data can tell stories about topics that matter. My team created “Women in STEM: Education Paths and Career Outcomes,” a dashboard examining global STEM education and U.S. workforce participation.
The moments I’m keeping
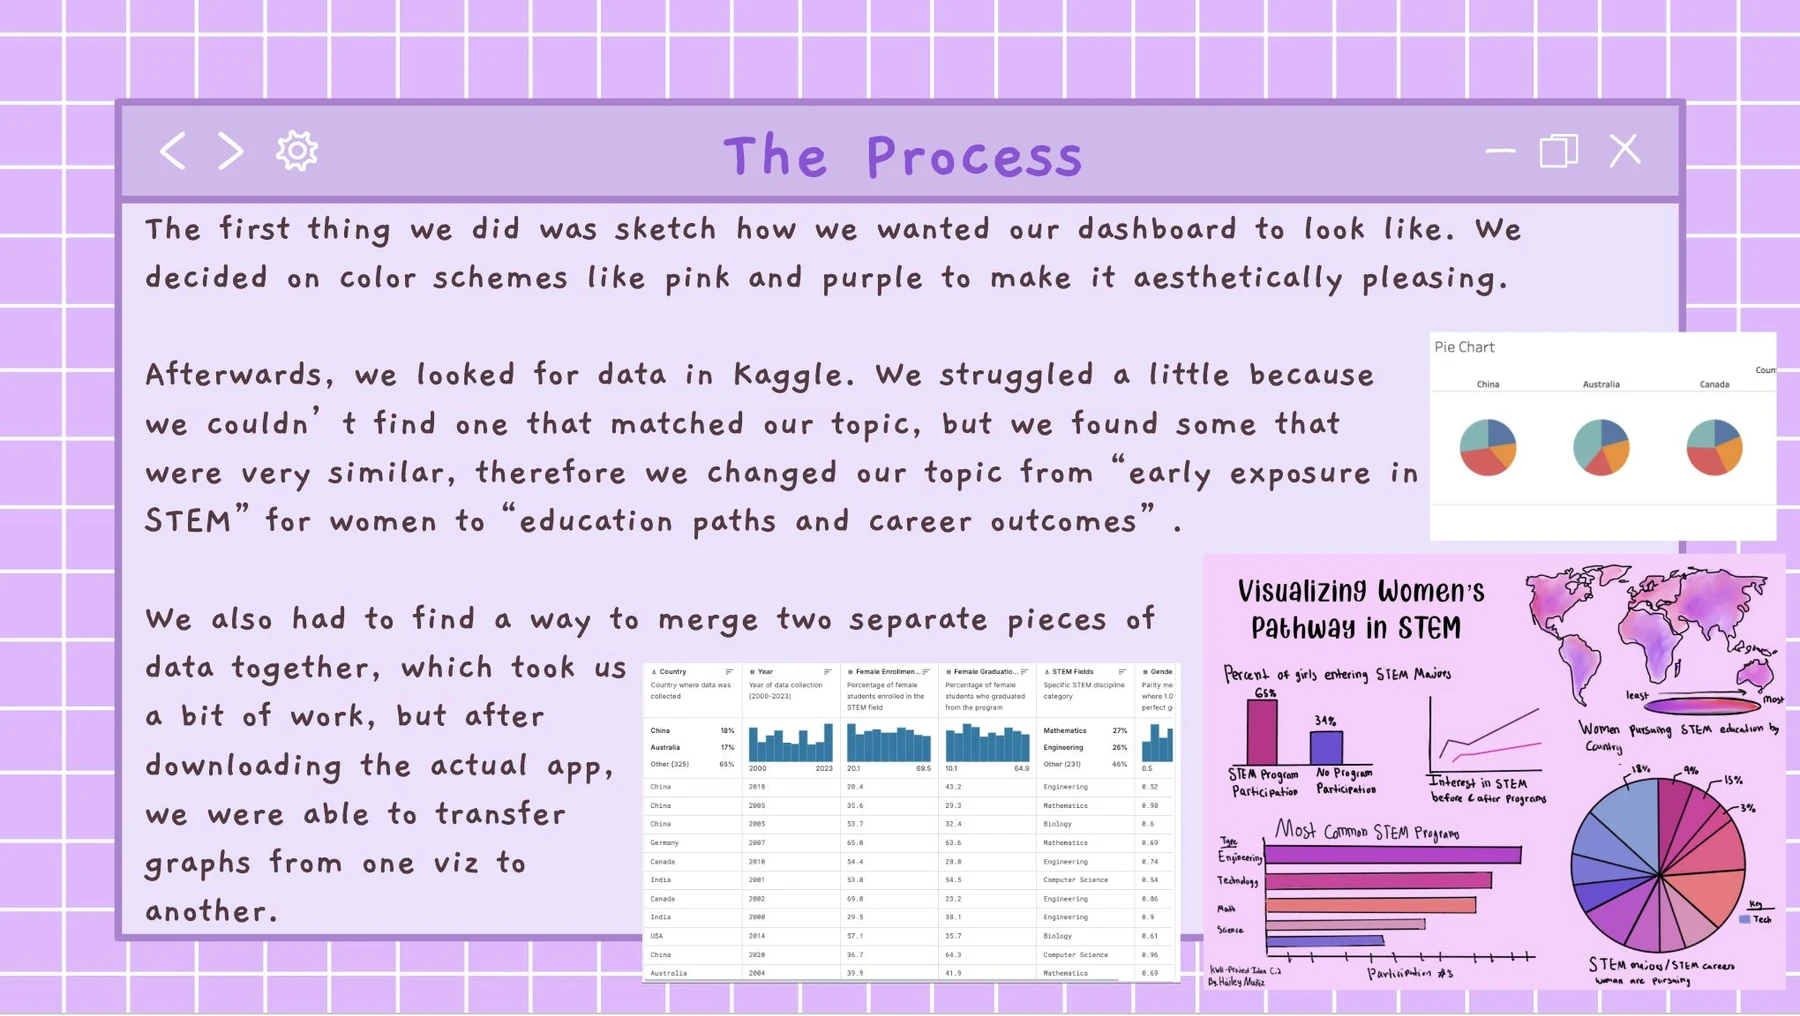
Sourced datasets on Kaggle and refined our focus after early data challenges.
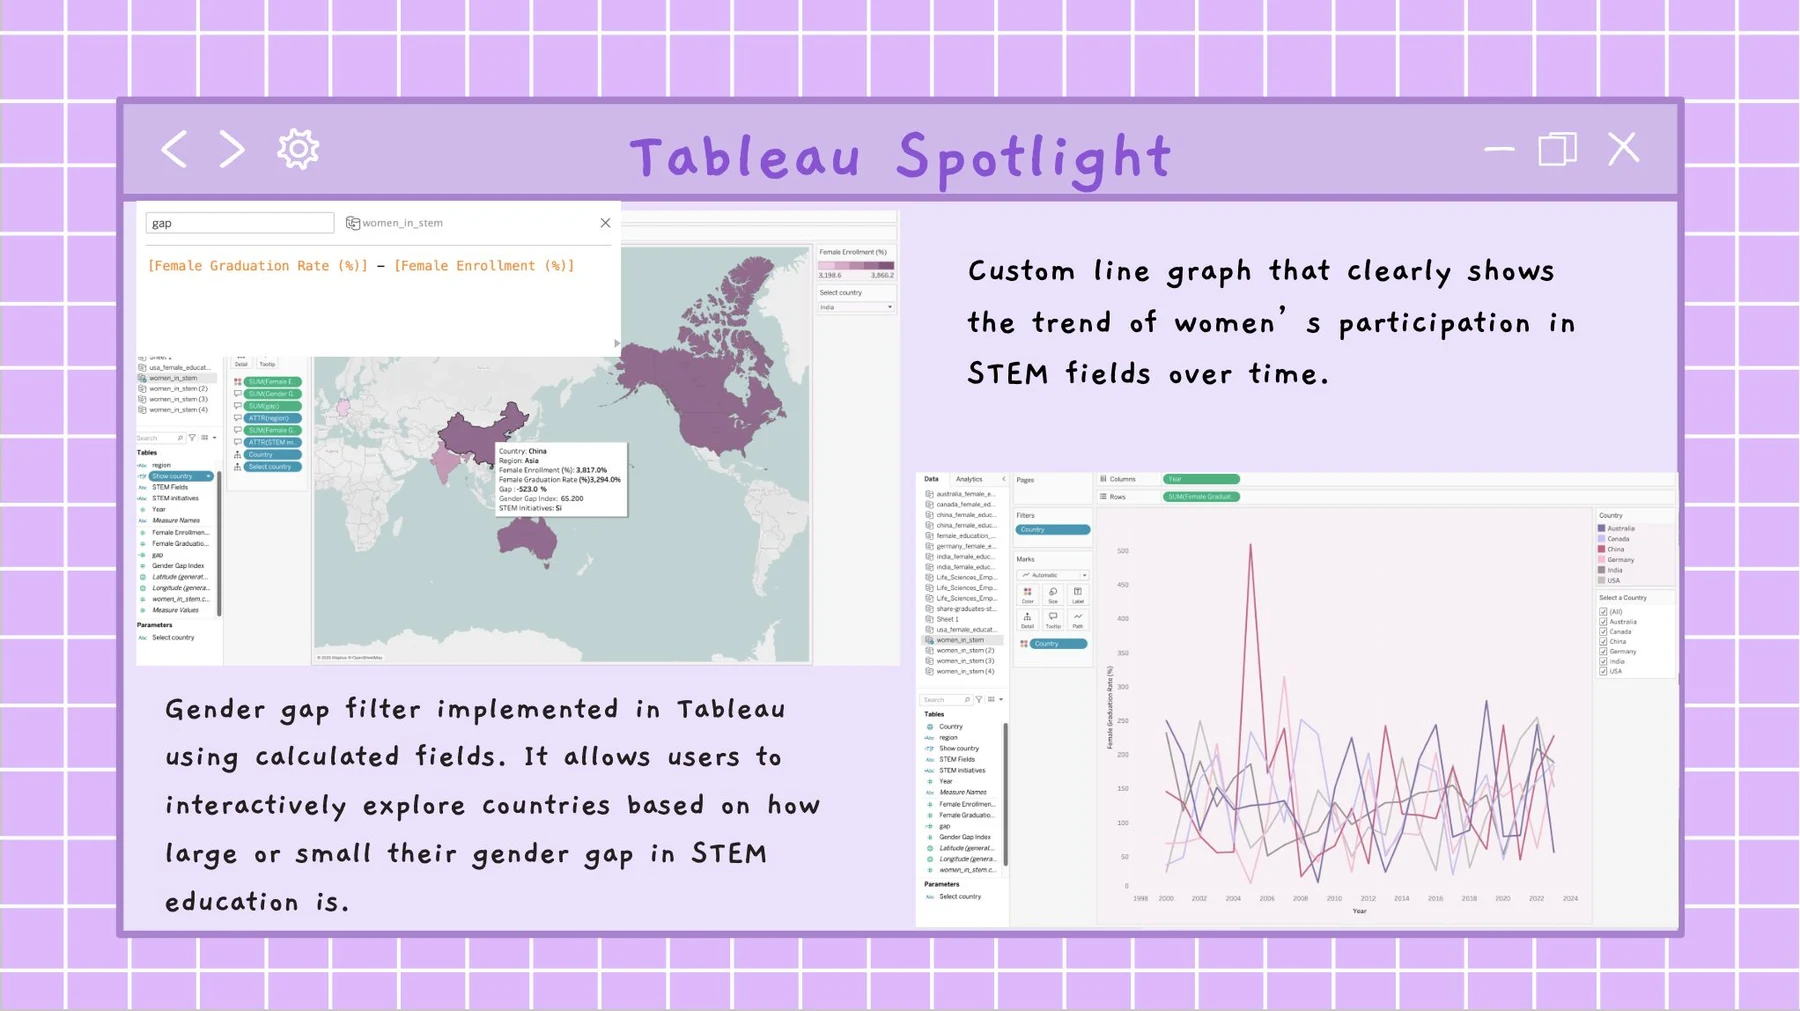
Wireframed the dashboard and built interactive Tableau visualizations of degree attainment, fields of study, and employment outcomes.
Used peer feedback to improve our work and presented it on Pitch Day.
Explored equity in AI, ethical innovation, and inclusive technology in Culture of Tech sessions.